Performance Monitoring in Complex Radar Installations
One of the challenges in the administration of complex multi-site data distribution systems is monitoring systems and networks to detect and localise problems. Has a network failed? Has a processor failed? Is there a connectivity problem? These problems arise in wide-area systems, where multiple sites feed data into a central location, and within each site there are multiple devices providing data streams. Getting the networking right, and becoming aware of problems and failures, is a key consideration. This problem is seen in complex radar installations, where multiple sensors provide data to a single site, which then needs to be aggregated before onward delivery to a central location. This article explains some of the challenges of network configuration and monitoring, and how automated monitoring may be used to provide high-level supervision and error detection.
Network Configuration
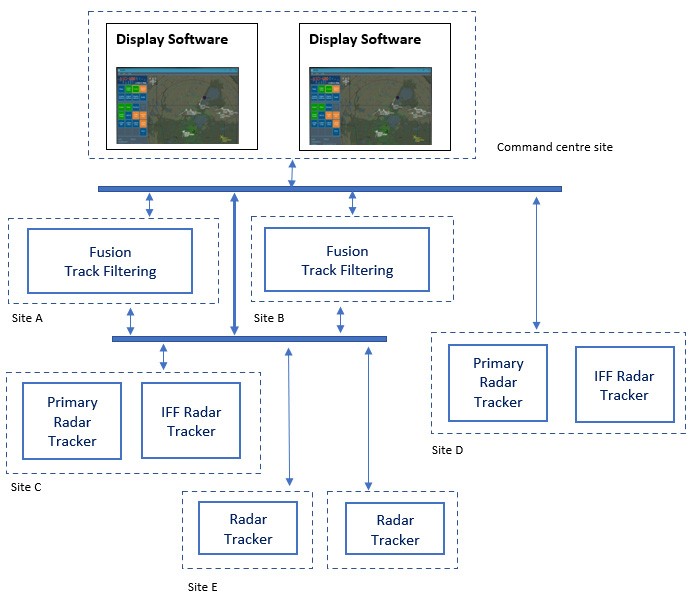
Consider a wide-area system of radars, radar processing components, displays, and command centre, as shown in Fig. 1.

In the system shown in Figure 1, there are nodes (local computers running software applications) providing radar video and track data onto a wide-area network. When the system is fully configured, it is expected that a set of software processes are running, and data is being distributed onto pre-set network addresses and ports. It is this expectation that can be used as the basis of a comparison with what is actually being observed. The difference between the actual and the pre-set expectation can then be used an indication of potential problems.
System Monitoring
The automatic monitoring of a system, such as shown in Figure 1, can consider the following:
- Are the expected software processes running on the individual nodes? For example, if a node is hosting a radar tracker then is that software process running and actively processing data (irrespective of whether it is generating tracks)? It would be useful to generate an alarm if a software process, or the computer hosting that process, appears to have failed.
- Is the expected data being received from a radar or camera sensor? The radar tracker process may be running, but may not be receiving data because a sensor has failed.
- Is there the expected level of network activity, indicating a connection between network nodes? This can be monitored using heartbeats, which are basic network packets that indicate status and health information. Heartbeats provide a method of confirming network connectivity independently of valid data.
- Are there system or process errors reported on a node? These might arise from local hardware failures, for example, and this information could be usefully be passed up the chain to a higher level.
- Does there appear to be a network clash, whereby separate nodes are sending data to the same multicast group? This is more likely to be an issue arising from incorrect system configuration.
Continuous monitoring of conditions, such as those listed above, serves to validate that the system as a whole is performing as expected. However, in the event of a test failing, the available information provides specific information to localise the error. It is this ability to localise the problem that offers the greatest benefit of this system monitoring. For example, a top-level failure to display tracks in the command centre is a system failure, but understanding that this is due to a failure in the network connectivity between two computers further down the hierarchy is a huge aid to rapidly resolving the issue.
Automatic Fault Detection
Complex multi-site installations such as that shown in Figure 1 need to be monitored to identify and localise problems. A failure for radar tracks to appear on the display at the top-level command centre, for example, is a serious problem, but it's a problem that can only be solved if there is some understanding of what component in the complex web of interconnected processing nodes has failed.
Based on many years of practical experience in fault-finding complex installations, Cambridge Pixel's engineers identified the potential benefits of a software tool that could automatically monitor hardware, software and network activity and report errors or discrepancies in a controlled way. This would assist in initial configuration of a system, ensuring that there was correct allocation of network addresses, but it would be especially important as an ongoing monitoring capability that could identify the underlying cause of the failures. So, if the situation arose whereby tracks were absent from a top-level command centre, the reason for that would be immediately available, allowing rapid remedial actions.
The basic structure of the automatic monitoring is that each node is responsible for three elements:
- Monitoring the activity of the hardware and software processes that reside on that node.
- Receiving information from downstream connected nodes
- Reported aggregated information to upstream connected nodes
Within a node, the monitoring looks at the activity state of installed software processes. There is a pre-set definition of what software processes are expected to be running and this is continually compared with the current state. Any discrepancies are potentially error conditions that may be reported upwards....
Subscribe to continue reading this article, it's free.
Free access to Engineering Insights, authored by our industry leading experts.
You will also receive the Cambridge Pixel newsletter which includes the latest Engineering Insights releases.
Fill in the form below and you will be sent an Instant Access link.


