This article explains the difference between radar video, radar plots and radar tracks.
A radar sensor transmits beams of RF energy and detects and measures the returned energy to provide an indication of objects in the direction the radar is pointing. The returned data is received as an analogue signal, which is then digitised as part of the signal processing of the radar receiver. In general terms, there is a processing progression from raw data to high-level interpretations of the data. This may be characterised as a flow from raw data to video to plots and finally to tracks.
The radar video is a set of digitised samples of radar intensity as a function of range for a particular pointing angle of the radar. Considering a surveillance-type radar that rotates and sends pulses of energy at regular intervals, the data received by the radar after each pulse is a sequence of samples that correspond to the reflected energy at each time interval, and hence each range.
In the image shown in Figure 1, we see the radar intensity as a function of range. The top trace shows the radar signal from zero range on the left side to 50km on the right side. The intensity of the signal varies according to the reflected radar energy, which arises from targets, clutter or noise. The lower trace below shows a zoomed view of the highlighted region in the top trace. This type of radar display image is called A-Scope. The data samples that are derived from this data is the radar video.

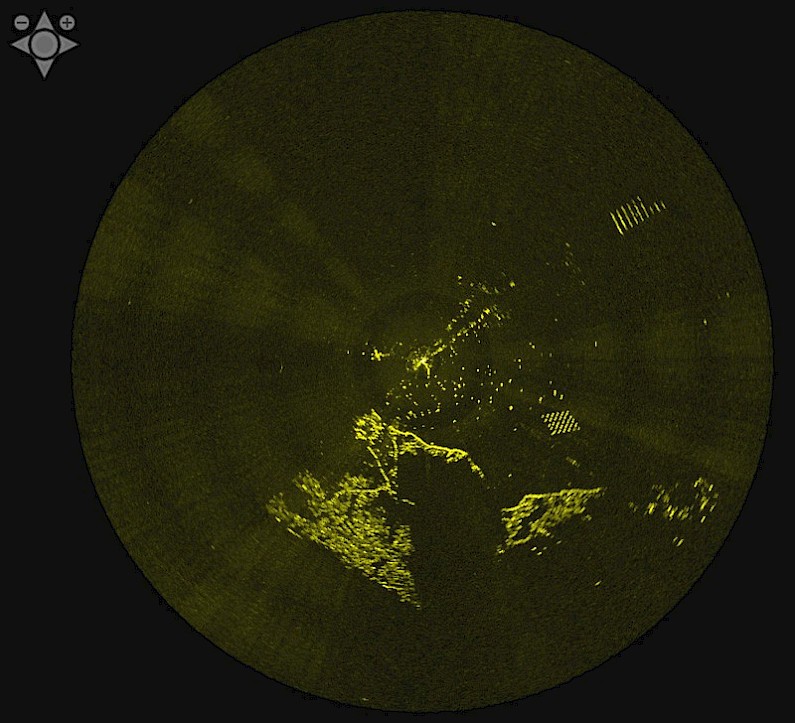
Note that the A-Scope form of display shown in Figure 1 is just one form of display of the radar video. We normally display radar video as a PPI image, as shown in Figure 2. In this display the image shows the reflected radar energy for each location. The original data is received from the radar in a range-angle format (essentially a sequence of traces of the form shown in Figure 1) and this is then converted to the image of Figure 2 using a process of scan-conversion. Both Figure 1 and Figure 2 show views of the radar video.

Radar video is the term used to describe the data provided by the radar. It's not strictly true that this is the raw data generated by the radar, as the raw data may have been processed to generate the video. The video is the information that is used to create a visual representation of the radar data, traditionally similar to that shown in Figure 2.
Plots
The next stage of processing is to convert the radar video into plots. These are sometimes called detections or measurements. A plot is a simplified representation of the radar video that extracts aspects of the data that are likely to be of interest.
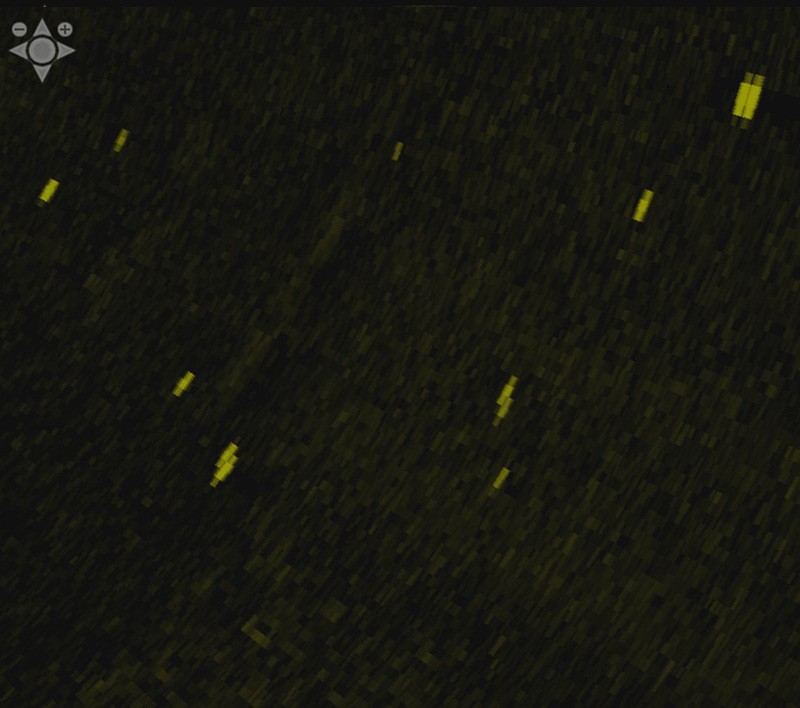
Consider a close-up view of the data in the PPI image of Figure 2, as shown by Figure 3.

The bright blobs in this radar video image are typical of targets-of-interest. They stand out from the background noise because they reflect more radar signal and therefore appear brighter. The process of extracting plots (or detections, or measurements) is a process of identifying the regions from the video that pass some test of intensity and size. In the case of the above image video data, the plot extraction process might result in an extraction of a set of plots, as shown in the image of Figure 4....
Subscribe to continue reading this article, it's free.
Free access to Engineering Insights, authored by our industry leading experts.
You will also receive the Cambridge Pixel newsletter which includes the latest Engineering Insights releases.
Fill in the form below and you will be sent an Instant Access link.

